The simulation plots are shown in the simulator tree at the left of the simulator window.
You can open additional plots in 20-sim.
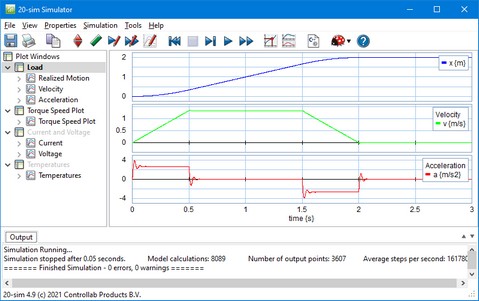
You can expand the simulator tree to see the plot windows. A plot window can contain one or more plots. A plot contains one or more curves. The curves show the simulated values of a chosen variable or parameter.
Plot Windows
A plot window contains the simulator tree and one or more plots. In the simulators tree, using the right mouse menu you can add or delete plot windows. You can also open a new plot window using the View menu of the Simulator.
Plot
You can add plots to a plot window. 20-sim supports the following plots:
| 1. | Plot: a standard plot showing one or more variables. |
Using the right mouse menu you can quickly:
| • | Add, delete, cut, copy and paste plots. |
| • | Disable and Enable plots. |
Note: With hide plot, the plot information is still calculated during simulation. If you use a large amount of plots this will affect memory space. With disable plot, the information is not calculated during simulation. This will save memory.
Curve
Each plot may contain one or more curves. Using the right mouse menu you can quickly:
| • | Add, delete, copy and paste curves. |
| • | Move curves Up and Down. |


